Tracking HIVE’s Uptrend: A Technical Analysis of Higher Lows and Highs
I created the above chart last night. However, I failed to publish it and my analysis immediately. I was so tired.
I think we are now all aware of the current price action of HIVE. But before I share the current chart, though late, I beg for your patience as I share my last night's analysis.
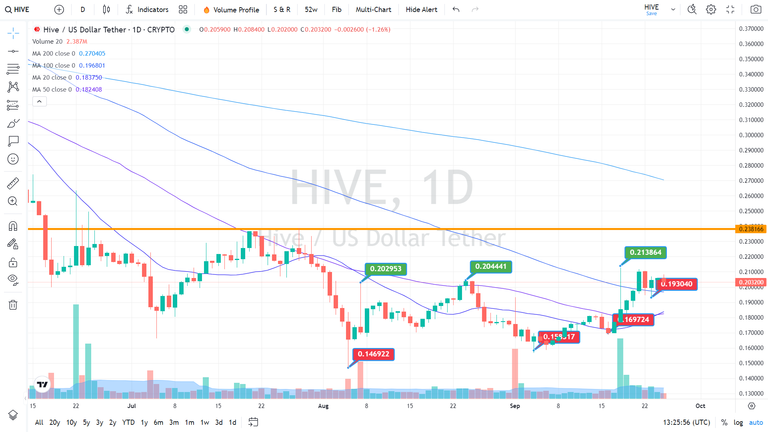
Based on the above daily chart, you can observe a series of higher lows and higher highs:
Higher Lows
0.146922 on 05 August
0.158317 on 04 September
0.169724 on 16 September, and
0.193040 yesterday
Higher Highs
0.202953 on 07 August
0.204441 on 24 August
0.213864 on 18 September
The series of higher lows and higher highs are indicators in technical analysis showing that a stock or a token is in an uptrend. Depending on the chart's timeframe, you can interpret this to identify a stock or a token's short-term, mid-term, and long-term trends. Based on this analysis, we can expect the formation of a new low and a new high in the coming days. This will serve as a confirmation that the token is in an uptrend.
Since the timeframe I used in the chart is daily, it tells us that HIVE is now dominated by bulls as far as its short-term trend. Regarding mid-term and long-term trends, it is still too early to say that a trend reversal has already taken place. Hive has to break its 200-day moving average (MA). Many analysts agree that this is a more reliable indicator when it comes to long-term trends. That means the price of HIVE has to break the 0.269 barrier.
Based on the above chart, HIVE's current resistance lies at 0.2391. If HIVE fails to break that, I expect a pullback but it won't break the 0.193040 low, at least as far as conventional analysis is concerned. In the game of probability, anything can happen.
HIVE's Moving Averages
So only the 200-day moving average shows that HIVE is still in a downtrend from a long-term perspective. The other three MAs (100-day, 50-day, and 20-day) tell otherwise.
Trading Insights
Since I am currently experimenting with micro-trading, I think it is better to trade a solid token like HIVE in an uptrend than a speculative one like DOMO and other Meme tokens in a downtrend. At least, when your trades go south, you still have a long-term prospect that after holding a token for weeks or a few months, there is a big chance that it will bounce.
If I bought HIVE last night and sold it today, I could have gained an easy 2 to 3 USDT. Unfortunately, the bored person in me prefers the more "exciting ones" and highly volatile token that changes prices in seconds. Last night, I made two trades in minutes buying 22.113 DOMO at 0.00009 and 32,608 DOMO at 0.000092. After less than five minutes I sold both of them at 0.00011 and 0.000108 respectively. I gained $0.95 in minutes.
Here's HIVE's latest chart:
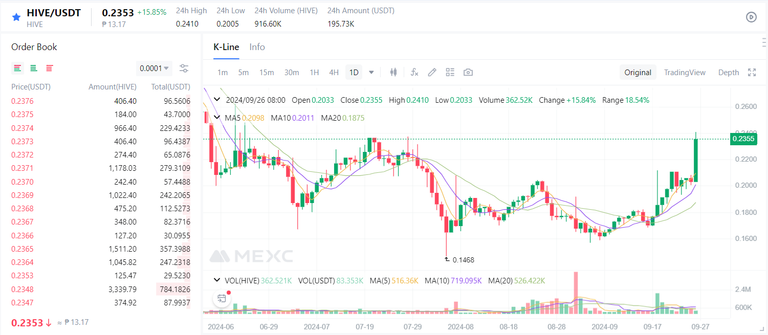
That last green candlestick is very strong. I wish to see that in the coming days, HIVE will break its 200-day MA at 0.269 and that the 0.2391 resistance will turn into support.
Grace and peace!
Posted Using InLeo Alpha
It's a long road back to $0.34, if the road is even going there anytime soon. Either way, happy with the extra pennies!!!! !LOL !BBH
lolztoken.com
They just don't want to.
Credit: reddit
@rzc24-nftbbg, I sent you an $LOLZ on behalf of ironshield
(4/10)
Delegate Hive Tokens to Farm $LOLZ and earn 110% Rewards. Learn more.
Yes, hitting 0.34 would require a change in the long-term trend.
@rzc24-nftbbg! @ironshield likes your content! so I just sent 1 BBH to your account on behalf of @ironshield. (8/100)
(html comment removed: )
)
🎉 Upvoted 🎉
👏 Keep Up the good work on Hive ♦️ 👏
❤️ @suteru suggested sagarkothari88 to upvote your post ❤️