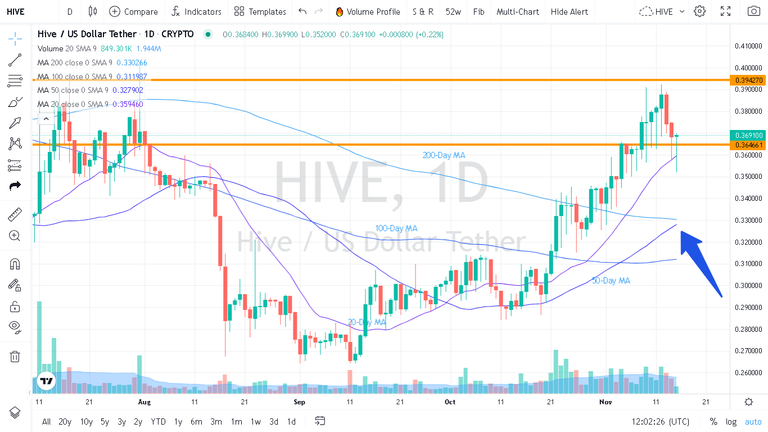
A Golden Cross?

Is technical analysis applicable to the crypto space? How would you read the above chart? What do you see?
The first thing that the chart tells us is about what happened on 04 November. $HIVE tested the resistance at 0.3645. After the fourth attempt, finally it went through and broke out the resistance.
Then the bulls tried to break through again the second resistance at 0.3942. However, after a second attempt, the price was retraced and broken down to the supposed "new floor" or "support price". The good thing about this retracement is that the "wick," also called as "shadow" or "tail" is long at the bottom of the candlestick. In technical analysis, we interpret this as the sellers trying to push the price lower during the trade, but buyers were able to bring the price back up, closing near the high of the price range. This means that the buyers are still in control of $HIVE's price action.
Another noteworthy observation is that the volume during that trading period is very small. There was no panic. Perhaps only a little profit taking took place.
The most significant indicator for me in the above chart is the movement of the 50-day moving average. It is about to kiss the 200-day moving average. Again, in technical analysis, they call it the "golden cross" once the 50-day moving average crosses above the 200-day moving average. This indicator is considered a bullish signal and is often interpreted as a continuation of the uptrend. Traders may see this as an indication to enter or hold.