What do the charts of both BTC and HIVE tell us about the current trend in crypto?
Visiting both the charts of BTC and HIVE reminds me of three articles I wrote. I published the first one in June of last year. I told there that I refused to join the choir of pessimistic outlooks about the trends in crypto simply because the chart tells me otherwise.
And then on 16 November last year, I based my analysis on BTC’s 78.6% Fibonacci Retracement and argued that instead of following the advice of one influencer to leave cryptocurrency for fear of deeper downside, we were actually witnessing Bitcoin’s floor price.
Of course, at that time, I was not confident with the result of my analysis. But seeing what actually happened since then, somehow I feel happy to see that though technical analysis is a game of probability, it provides a certain degree of direction when it comes to market trends.
I wrote the third and last article on the 20th of March this year. I argued in that article that simply basing our conclusion on reading the chart, one can say that though the bulls remain cautious and silent, they are already here.
This time, simply revisiting the BTC’s chart, you can observe that after a short rally that started in November of last year, the price of Bitcoin consolidated for almost a month between the second week of March and last week. After taking a brief rest and profit-taking, the bulls seem to regain again the upper hand and are now ready for another run.
Providing the background of the current uptrend, allow me to quote what I wrote in my June 2022 article:
. . . considering the length of time, the five waves that started in 2017 are classified as Intermediate and that peak price in November last year is considered the Primary Wave 1. What followed next is Primary Wave 2, a retracement wave composed of three Intermediate waves (A to C).
In my analysis, the last Intermediate Wave, which is Wave C, to complete Primary Wave 2 is a retracement of the Wave 1 rally that started in 2017. And this corrected wave is already done last November. In my wild guess, what we are about to witness in the coming months and years is the formation of Primary Wave 3. In my books, Wave 3 is a wonder to behold for this is the strongest motive wave in Elliot Wave Theory. If the first wave lasts for more or less four to five years, this uptrend will be longer than that.
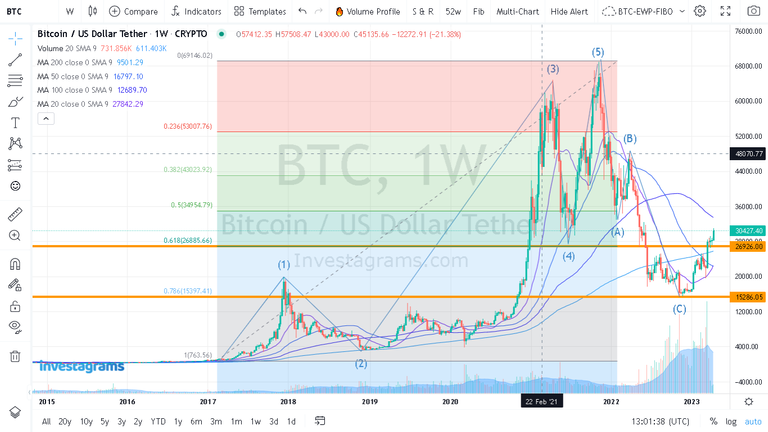
As you can see in the chart above, the resistance in the 27,000 area has already been broken. What we are witnessing now is a formation of small waves within the larger wave, or in the language of EWT, the formation of Intermediate Waves within the Primary Wave.
Moreover, even the moving averages that indicate both short-term and long-term trends indicate a bullish sentiment. 20 MA is about to cross both 50 MA and 200 MA. Only 100 MA remains above the market price of Bitcoin.
What is the implication of this for HIVE?
If it is really true that Bitcoin dictates the overall movement in cryptocurrency, such price action should be considered positive for the space particularly those blockchain networks and crypto projects that focus on development and usefulness.
Looking at HIVE’s chart, though the price action of the token seems different from BTC, I see that the moving averages tell us a different story.
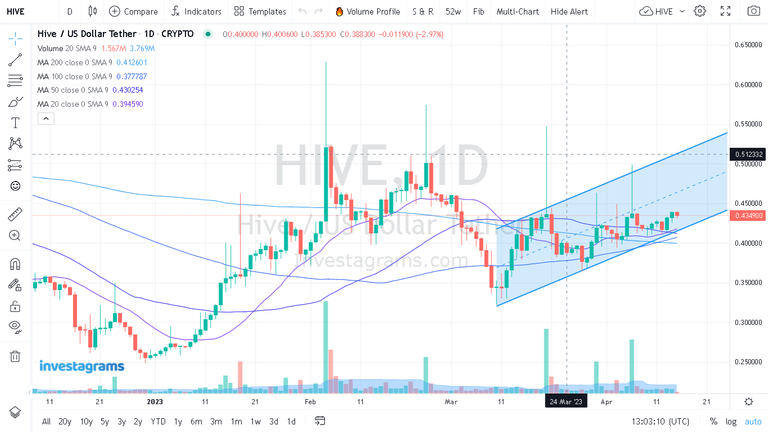
If you will just carefully observe the four moving averages, you can see that the 100 MA has just crossed the 200 MA around the 11th of April whereas the 20 MA crossed the 50 MA two days after. In my reading, the first one indicates a change in long-term trends while the second shows a change in direction in short-term trends.
https://leofinance.io/threads/@rzc24-nftbbg/re-leothreads-28xqkmvdr
The rewards earned on this comment will go directly to the people ( rzc24-nftbbg ) sharing the post on LeoThreads,LikeTu,dBuzz.
Congratulations @rzc24-nftbbg! You received a personal badge!
Thank you for participating in the Leo Power Up day.
You can view your badges on your board and compare yourself to others in the Ranking
Check out our last posts:
This is some article. Trends spotted can make a huge difference in one's resources. So glad I am a hodler. Bravo my friend!
Thank you that you like it. Blessings!
!PIZZA
!CTP
$PIZZA slices delivered:
@rzc24-nftbbg(3/5) tipped @adcreatordesign (x2)
rzc24-nftbbg tipped jpiekiel
Nice use of moving averages. !BBH
@rzc24-nftbbg! Your Content Is Awesome so I just sent 1 $BBH (Bitcoin Backed Hive) to your account on behalf of @fiberfrau. (2/5)
Thanks!
Thank you @rzc24-nftbbg I looked up what MA meant. MA means "moving average".
The Elliot wave theory tells us a lot about what's happening with BTC and Hive.
Have a great week!
Barb 😊
!BBH !CTP
Yes, the four moving averages I used are the typical MAs utilized to determine both long-term and short-term trends. But as I mentioned even in my previous articles, technical analysis is not a precise discipline but a game of probability.
Thanks!
!PIZZA
!CTP
OK @rzc24-nftbbg it's interesting. Do they compare what really happens to the analysis to see how close it was?
You're welcome. !BBH !CTP
That's the nature of the technical analysis. Sometimes, you got it right, and at other times you got it wrong. When you got it wrong, an analyst must be willing to discard his chart and will start looking for an alternative reading.
!PIZZA
!CTP
Oh OK @rzc24-nftbbg it does not sound reliable does it. Maybe doing comparisons help the analyst? I guess some charts are better than other charts. Thanks for the info. Have a great week! !BBH !CTP
Yes, reliability is not its game.
!BBH
!CTP
@adcreatordesign! Your Content Is Awesome so I just sent 1 $BBH (Bitcoin Backed Hive) to your account on behalf of @rzc24-nftbbg. (1/5)
Thank you @rzc24-nftbbg !BBH !CTP